Data visualization is an excellent tool for improving student engagement and teacher performance in learning analytics. Data visualizations, such as graphs and charts, can help identify risks to avoid and opportunities to invest in. They can provide teachers with clarity and assist them in making quick decisions about what students genuinely require.
Also, each educational institution has a sizable data collection, and you can use that data for more than just collecting and storing it. You could tell a story or develop a shared understanding based on knowledge.

Data Visualization for Learning
What is Data Visualization?
Data visualization is a technique that can be used to make complex information more accessible and understandable. It allows educators to create graphical representations of data that can help students understand complex concepts in a way that is easy to comprehend. Additionally, it can help teachers make informed decisions about teaching and learning materials.
Here are Some Significant Benefits of Data Visualization :
- Many data visualization tools are available online, so you don’t need special training or expertise. Upload your data into the tool, customize the design according to your needs, and share it with your students. Data visualizations can also be used as classroom assignments or assessment requirements.
- They provide teachers with an easy way to present complex information in an easily digestible format, helping students learn to analyze data critically and research relevant issues.
- One of the most popular educational data visualization uses is charting. Charting allows educators to present information clearly and concisely by displaying trends over time or across different data groups. It can be invaluable when understanding complicated topics or plots relating to statistics or science experiments.
- Beyond charting, data visualization enables educators to graphically represent qualitative information such as interviews or focus group results. Visual cues such as color coding, fonts, and layout techniques can easily show how various perspectives influence each other while highlighting key points on the charts themselves.
- Overall, data visualization helps educators communicate information more effectively and make sense of complex matters quickly and easily, an essential skill for educating tomorrow’s leaders!
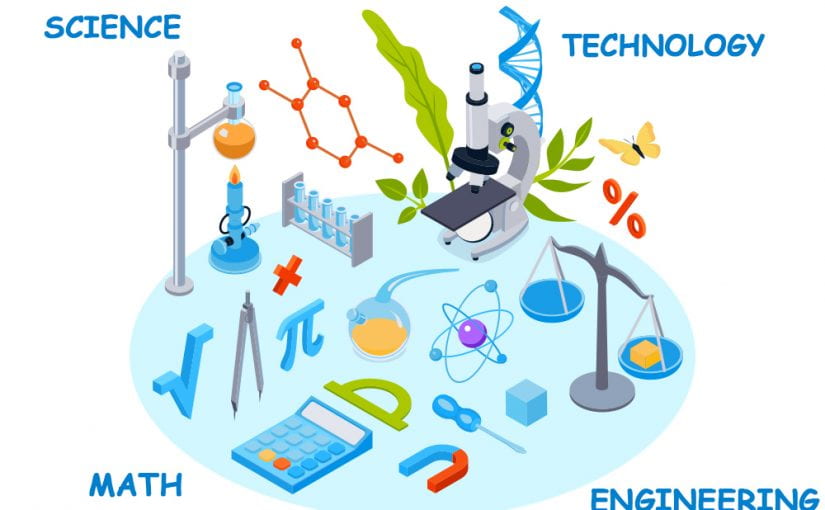
Each STEM field benefits from data understanding, as do marketing, finance, history, consumer goods, service and IT industries, education, sports, and so on. At ILM, we emphasize data visualization for learning, as it is an essential skill for any modern-day educator. To learn more about it, book your free session now!


